
Your ledger in.A board-ready cost model out.
Inturol scopes, classifies, reconciles, and allocates. You approve the close calls.
Inturol scopes your accounts, IT vs non-IT, in under a minute.
Upload your Chart of Accounts. A scope pass tags every account in-scope, out-of-scope, or ambiguous and flags whether it's spend, depreciation, or intercompany; a second pass proposes a Cost Pool for each IT account. You confirm only the handful that need a second pair of eyes.
- Two passes at upload: scope (IT vs non-IT, plus spend vs depreciation) and Cost Pool tagging.
- ~90% of accounts auto-tagged on the first pass.
- Your confirmations lock in permanently, never re-litigated.
IT spend is scattered across dozens of accounts, and no two companies draw the line the same way. Inturol's scope pass makes that call on every account up front, so about 90% is settled before an analyst looks.
- 6002SaaS Subscriptionsin-scopeSoftware & SaaS
- 7001Cloud Computingin-scopeCloud Services
- 5001Wages, IT Deptin-scopeInternal Labor
- 6001Software Maintenancein-scopeSoftware & SaaS
- 1450Capitalized Software, Amort.in-scopeHardware & Infra
- 8001Rent / Lease Expenseout-of-scopen/a
- 2001Office Adminout-of-scopen/a
- 6105Professional Services, generalreviewOutside Services
Start with the General Ledger. Add other sources as you have them.
GL alone produces most of the standard reports. Each enrichment source you connect unlocks something specific, and is auto-detected from its column headers, so there's no mapping project to start.
- GL is the only requirement to begin. Everything else is incremental.
- Each new source is recognized from its column headers automatically.
- Every source adds discrete relationships, not a re-model.
Cloud, HR, contracts, CMDB, tickets, each in its own format. Inturol auto-detects and stitches them together on upload, so there's nothing to wire up by hand.
- Executive ReviewGL
- Spend by CategoryGL
- Cost by Business UnitGL
- Vendor ReviewGL
- Run / Grow / TransformGL
- Expense vs InvestmentGL
- Budget vs Actual+ Budget plan
- Cloud Review+ Cloud billing
- Labor & Workforce+ HR roster
- Renewals Calendar+ Contracts
- Initiative TCO+ Financial assets
Inturol connects every dot. You check only the ones it wasn't sure about.
Inturol classifies every GL line, links vendors to apps and apps to initiatives, and flags only the rows it isn't sure about for your review, each decision shown with the reasoning behind it. Most rows never need you; the handful that do are surfaced, not buried.
Every source you connect feeds the cascade. Inturol weaves vendors to apps, GL lines to contracts, and assets to initiatives, unlocking the capabilities on the right.
- 7001 · Cloud ComputingAWS$312,800auto-classified
Recurring cloud spend on a confirmed-IT account, mapped to cloud infrastructure.
Cloud & Infrastructure → IaaS0.98 - 6002 · SaaS SubscriptionsSalesforce$128,400auto-classified
Recurring SaaS vendor, mapped to the application layer.
Applications → SaaS / CRM0.97 - 8001 · Rent / Lease ExpenseHines REIT$84,000auto · non-IT
A facilities account, not IT, so excluded from IT spend automatically.
Non-IT (excluded)1.00 - 6105 · Professional ServicesUndisclosed LLC$46,200needs review
Ambiguous vendor and a generic memo, too low-confidence to assign, so Inturol flags it for you.
Flagged for one analyst pass0.54
Inconsistent descriptions, the same vendor under five spellings, re-runs that used to drift. Inturol is built around those failures, not around the happy path. Every row carries a confidence score, and only the low-confidence ones reach you.
Defensible numbers, end to end.
When your CFO asks how a number was calculated, you show the chain, from raw GL line to allocated chargeback. Inturol reconciles at every stage of the cascade and surfaces any unclassified residue explicitly. Usually under half a percent.
- Every figure traces from GL line → classification → allocation → showback.
- Classified totals reconcile to the raw GL, with any residue surfaced, never dropped.
- One model both Finance and IT read from. No dueling spreadsheets.
Most tools can't say why a total moved. Inturol ties every figure back to source and shows exactly what changed, so Finance and IT work from one number.
Show every BU exactly what they consume, and how it's calculated.
Direct costs trace to the apps a business unit actually uses. Shared services like networking, security, and IT leadership split by the driver that correlates: headcount, ticket volume, cloud usage. Inturol proposes the driver; your analyst approves. Every BU can see the math behind its number.
- Direct costs trace to the apps a BU actually uses.
- Shared costs split by a driver that correlates, shown in full.
- Two-tier allocation, with full lineage back to the GL.
Networking, security, and IT leadership serve everyone. Inturol splits them on a driver that correlates and shows the math, so every BU can see exactly why its number is what it is.
Answer the questions your board actually asks.
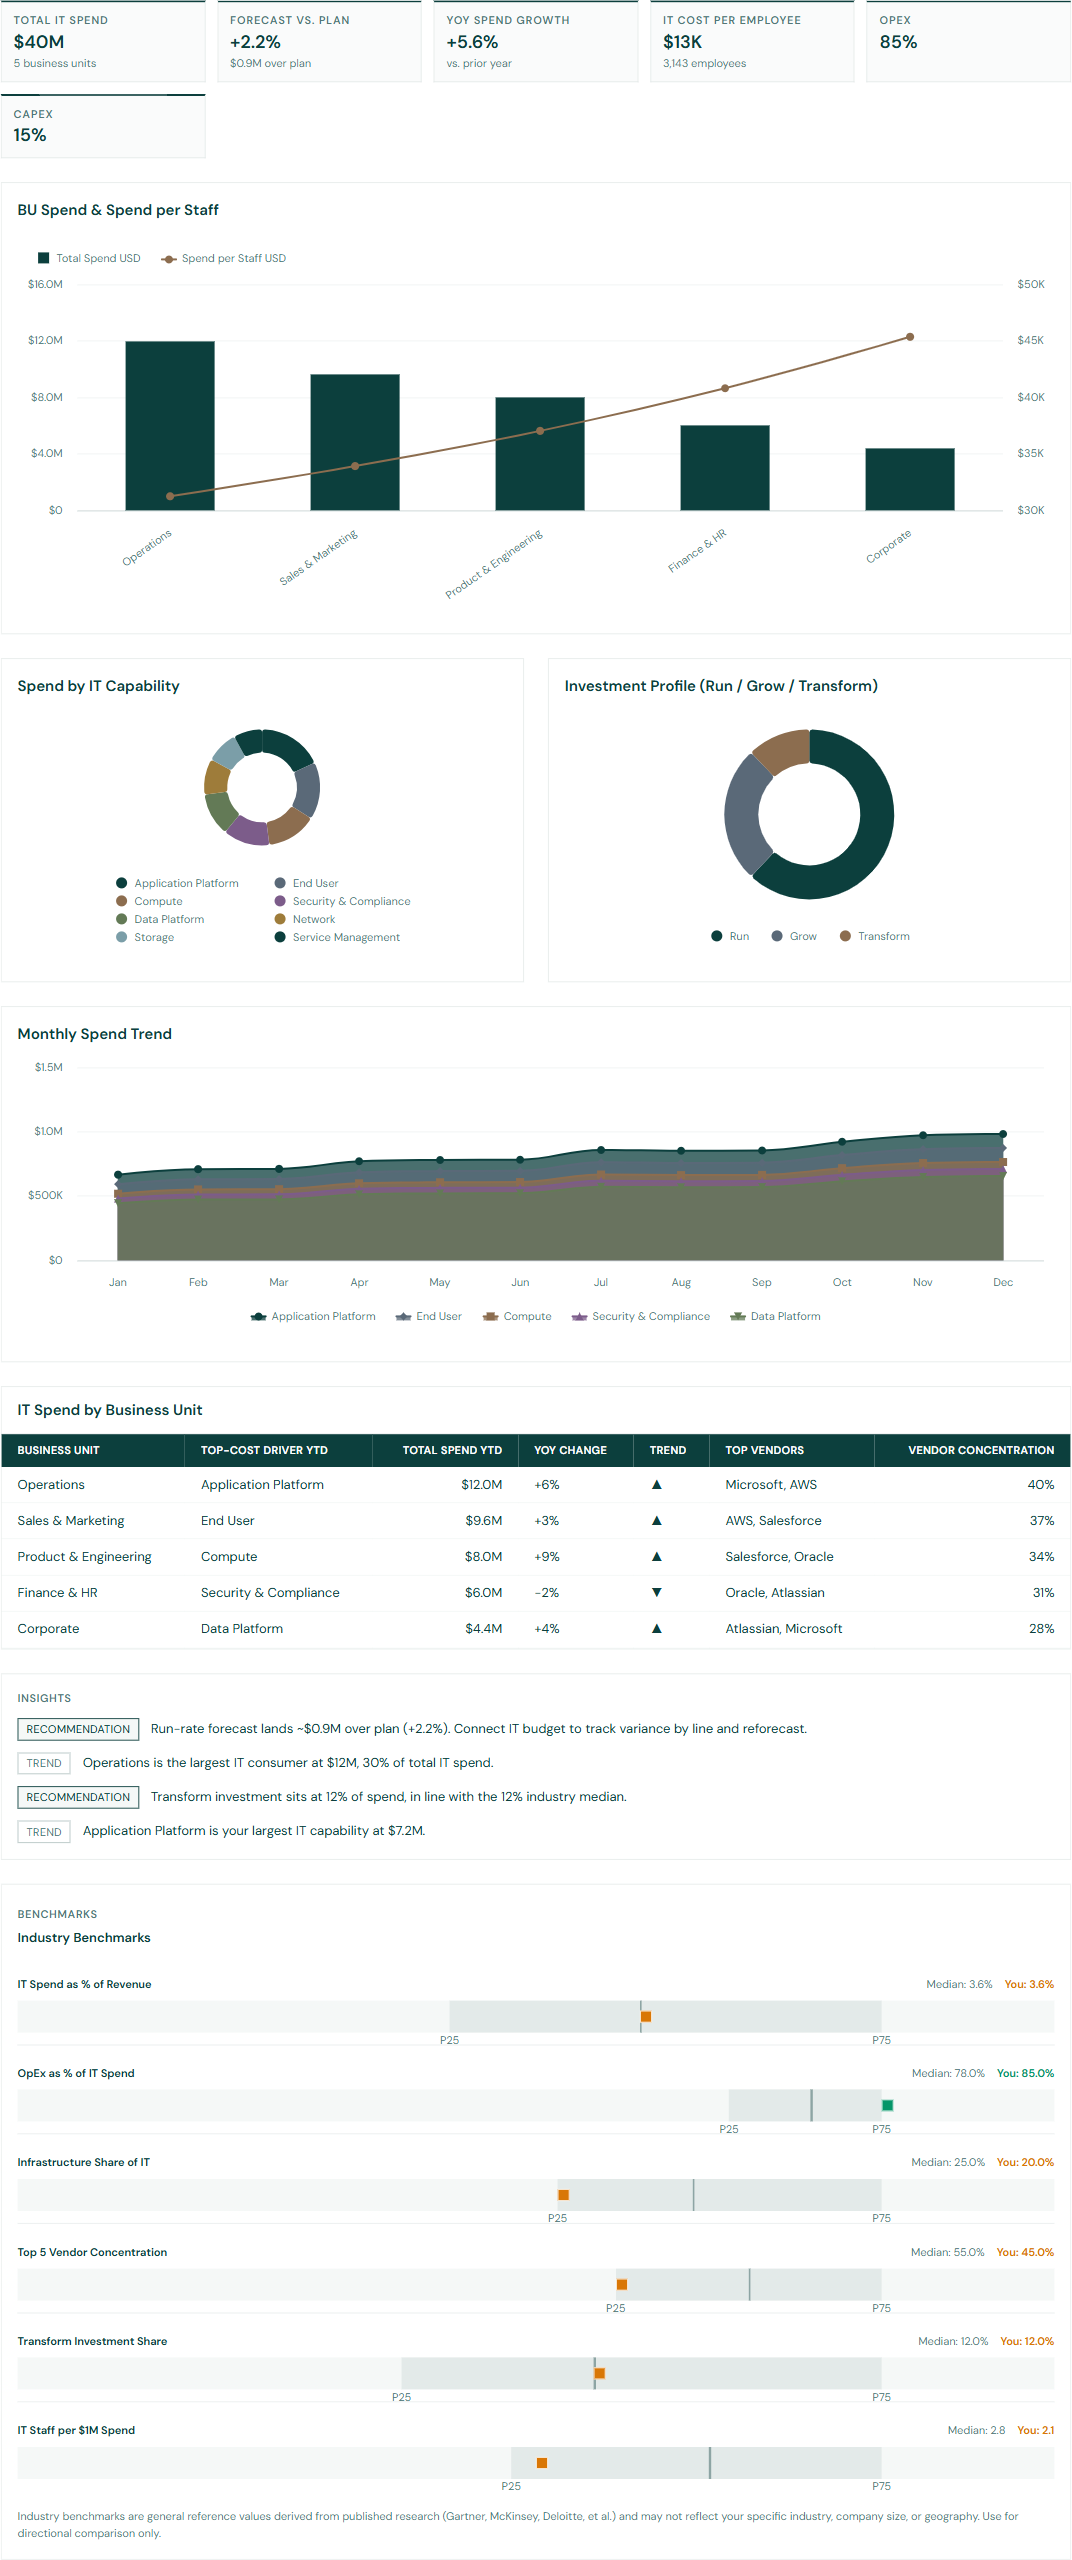
Board-ready report templates, auto-composed from your cost model with industry benchmarks built in, plus natural-language access to the whole model. Nothing to author; everything stays current as new data lands.
Ask Inturol queries your connected model and returns numbers with the underlying GL rows attached. No SQL, no analyst middle-step.
A defensible IT cost model in days, curated by the team you have, not the one you’d hire.
Upload your Chart of Accounts and one GL period. Inturol proposes the model, you approve the close calls, and every number traces back to the line it came from. It runs on the team and the data you already have.
Book a demo
See Inturol on your own data.
A focused walkthrough on your own numbers, with our team.
- Runs on your chart of accounts and a ledger export
- Your IT spend, classified by capability and reconciled to source
- 30 minutes with our team, mapped to your environment